
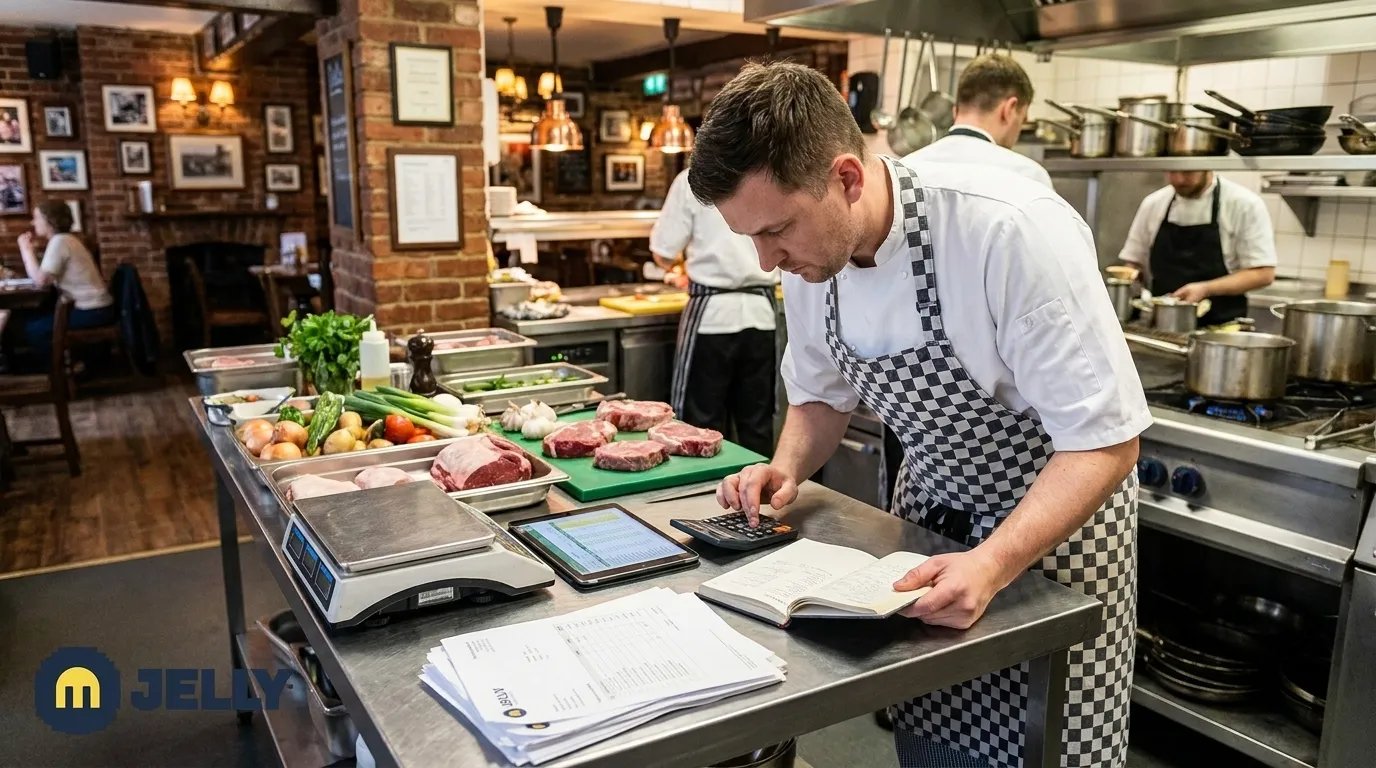
Written by: JJ Tan, Founder, Jelly
Key Takeaways for Controlling Pub Food Cost
- Food cost percentage equals cost of goods sold divided by net food sales (VAT-exclusive), multiplied by 100. UK pubs typically target 28–35%.
- Supplier price rises, portion creep, and un-costed specials can push food cost above 35%, eroding gross profit by about £6,000 per percentage point on a £600k food revenue site.
- Accurate weekly calculations rely on three inputs: line-item supplier invoices, standardised recipes with yield factors, and matching POS sales data for the same Monday–Sunday period.
- Category targets such as burgers at 26–33%, fried sides at 15–22%, and pub mains at 28–32%, plus the 30-30-30 prime-cost rule, help chefs design menus with healthy blended margins.
- See how Jelly automates these calculations, replacing manual spreadsheets with automated invoice scanning, live recipe costing, and daily margin reporting across single or multi-site pubs.
The Problem: Drifting Food Cost Percentages in UK Pubs
Food cost percentages usually drift over time rather than spike in a single week. A supplier quietly raises beef prices, portion sizes creep up during a busy Saturday service, and a new specials board goes live without recipe costing. By the time a monthly report reaches a finance manager, the damage often runs four weeks deep.
UK foodservice prices rose 0.2% month-on-month in April 2026, driven by seafood, fresh produce, and beverages, with analysts warning that forward-contract buffers are thinning. Beef and veal prices rose 2.5% year-over-year in mid-2026 with fats and oils up 3.8% YoY; no evidence supports 9%, 14% or 22% quarterly rises for beef, oil or avocado. A pub running a 33% food cost in January can sit at 37% by March without a single deliberate decision.
The impact is immediate. Every percentage point above target on a site turning £600k in food revenue represents £6,000 in lost gross profit annually. A mid-2026 survey of over 420 operators found 86.6% reported rising food costs, with 78% expecting further increases through the rest of the year.
Prerequisites: Core Data You Need Before Calculating Food Cost
To catch cost drift before it compounds, you need three solid inputs that make every food cost calculation reliable. Without these foundations, any percentage you calculate will be too imprecise to guide action.
Three inputs are required before any food cost calculation is meaningful:
- Supplier invoices at line-item level. Every ingredient, quantity, unit price, and delivery charge must be captured. Invoices that arrive as PDFs or paper copies need digitising before they can feed a formula.
- Standardised recipes with yield factors. A burger recipe that lists “beef patty” without trim loss or batch size produces a theoretical cost that does not match what the kitchen actually spends.
- POS sales data by item. Net food sales after discounts and comps must be pulled from the POS for the exact same date range as the inventory period. Paper goods, cleaning supplies, and smallwares must be excluded from purchases and coded separately to avoid distorting the food cost percentage.
All three inputs must cover the identical reporting window. Mixing a Monday–Sunday inventory count with a Tuesday–Monday sales figure produces a number that cannot be trusted or acted on.
What a 33% Food Cost Percentage Really Means
A 33% food cost percentage means that for every £1.00 of net food revenue, £0.33 goes to ingredients and £0.67 remains as gross profit on food before labour, rent, and overheads. UK pub food operations target a 65–70% GP% on food in 2026, so a 33% food cost sits at the acceptable upper boundary of that range.
The calculation must use VAT-exclusive net revenue. Using gross VAT-inclusive revenue understates the food cost percentage by 5–6 percentage points for 20% VAT, so a pub that believes it is running at 33% may actually be running at 38% once VAT is stripped out. Divide every menu price by 1.20 before running the formula.
When food cost sits consistently above 33%, start with portion control on high-cost proteins, untracked staff meals, and supplier price increases that have not flowed through to menu pricing. Regular recipe recosting then supports improved net profit margins.
The 30-30-30 Rule for Pub Prime Cost
Knowing your food cost in isolation only tells part of the story. The 30-30-30 rule adds context by showing whether your overall cost structure supports sustainable profit.
The 30-30-30 rule is a prime cost framework used in pub and restaurant operations to allocate the three largest variable cost categories as a percentage of net revenue:
- 30% food cost for ingredient spend as a proportion of net food sales.
- 30% labour cost for kitchen and front-of-house wages, including employer NI and pension contributions.
- 30% overhead for rent, utilities, rates, insurance, and other fixed and semi-fixed costs.
The remaining 10% represents net profit before tax. Prime cost for bar and pub operations should typically sit between 55% and 65% of revenue for healthy performance.
The 30-30-30 rule works as a planning benchmark rather than a rigid target. A pub with strong wet sales can tolerate a 33% food cost because high-margin beverage revenue lifts the blended GP. A food-led pub with limited bar trade usually needs food cost closer to 28–30% to protect overall profitability.
Category Food Cost Targets for Burgers, Sides, and Pub Mains
Category-level targets help head chefs design menus deliberately instead of chasing a single blended percentage. Burgers often carry a target food cost of 25–35%, with a typical build landing around 30%. Fried sides such as chips and onion rings can target food costs of 15–25%, making them the highest-margin items on many pub menus and a key lever for blended cost management.
| Menu Category | Target Food Cost % | Example Dish | Worked £ Example (VAT-ex) |
|---|---|---|---|
| Burgers & beef mains | 26–33% | Classic cheeseburger & fries | Ingredient cost £3.90 ÷ menu price £13.33 = 29.3% |
| Fried sides | 15–22% | Skin-on fries | Ingredient cost £0.65 ÷ menu price £3.75 = 17.3% |
| Shareables & snacks | 22–28% | Loaded nachos | Ingredient cost £2.10 ÷ menu price £8.33 = 25.2% |
| Pub mains (fish, chicken, pie) | 28–32% | Beer-battered cod & chips | Ingredient cost £4.40 ÷ menu price £14.58 = 30.2% |
All menu prices above are shown VAT-exclusive, so divide the customer-facing price by 1.20. UK pubs raised same-line dish prices by 4.2% between Spring/Summer 2024 and Spring/Summer 2025, so re-cost these examples against current supplier invoices before use.
Weekly Food Cost Formula for Pubs
Weekly food cost tracking gives earlier warning than monthly reporting. The standard formula is: Food Cost % = (Beginning Inventory + Purchases − Ending Inventory) ÷ Net Food Sales × 100.
| Step | Action | Pub Example (£) | Success Criteria |
|---|---|---|---|
| 1 | Record beginning inventory (Monday pre-service count across all storage areas) | £4,100 | Matches prior week's closing count exactly |
| 2 | Sum all food purchases from supplier invoices (Monday–Sunday, VAT-exclusive, food only) | £6,900 | Every invoice line item captured, non-food items excluded |
| 3 | Record ending inventory (Sunday post-service count) | £4,400 | All locations counted: fridge, freezer, dry store, prep areas |
| 4 | Calculate COGS: Beginning + Purchases − Ending | £4,100 + £6,900 − £4,400 = £6,600 | Variance vs theoretical COGS within 2–5% |
| 5 | Divide COGS by net food sales (VAT-exclusive POS data, same Monday–Sunday window) | £6,600 ÷ £21,000 = 31.4% | Result within 28–35% target, investigate if above 35% |
This worked example is drawn from Teal Farm Pub operations data published by Shaun McManus. The 68.6% gross profit on food in this example provides room to absorb labour and overhead costs while still supporting the 10% net profit target in the 30-30-30 framework.
Closing the Gap: Portion Control, Waste Tracking, and Price Checks
The gap between theoretical food cost and actual food cost is where margin disappears. A well-run multi-site operation targets food cost variance of 2–3%.
Three weekly checks close the gap, with each one addressing a different source of variance:
- Portion control audit catches over-portioning before it compounds. Weigh the top five highest-cost ingredients against recipe cards at the start of each service. Reducing operational waste from 6–8% to 3–4% of purchases through portion control and FIFO rotation recovers 1.5–2.5 points of net margin without menu price changes.
- Waste log reconciliation captures the gap between what was purchased and what was sold. Every item discarded, voided, or used for staff meals must be recorded and deducted from theoretical COGS, because unrecorded food waste can account for a notable proportion of purchases.
- Supplier price review keeps theoretical costs aligned with current market prices. Compare this week's invoices against the prior week line by line. In 2026, suppliers reprice ingredients 2–8 times per year depending on category (for example, 3–6 times for meat and fish), so a weekly invoice check is the minimum cadence for catching increases before they compound. A weekly stock check against par levels can also help cut food cost.
How to Measure Success of Your Food Cost System
Effective food cost control produces measurable outcomes across three dimensions that together show whether your system is working.
- Food cost percentage within 28–35% weekly proves your controls are holding. Month-to-month variance in food cost should be monitored, because larger swings suggest measurement error, theft, waste, or major operational change.
- Reduced admin time frees your team to act on the data rather than just collect it. A manual weekly COGS process takes several hours per week, time that automation can redirect toward portion audits and supplier negotiations.
- Faster supplier price response protects margin in real time. Tools that enable quicker recosting can cut reaction time to ingredient price increases from weeks to days, supporting margin improvement before losses compound.
Scaling Food Cost Control Across Multiple Sites with Jelly
Manual spreadsheet processes usually break down once you operate more than one or two sites. A head chef managing several locations cannot count inventory at each site every Sunday morning, and a finance manager waiting for monthly reports cannot react to a beef price increase that happened three weeks earlier.
Jelly automates the flow from invoice capture to live margin reporting. Every supplier invoice, whether emailed directly or photographed in the kitchen, is scanned at line-item level and updates ingredient costs across every recipe instantly. When a supplier raises the price of a beef patty, every burger on the menu shows a revised food cost percentage in real time, with a price alert flagging the change so the team can negotiate a credit note or adjust the menu price before the week's trading finishes.
Jelly's Flash Report delivers a daily, weekly, or monthly view of gross profit margin calculated from invoice costs and POS sales data. Native integrations with Square, EPOS Now, Lightspeed, and Toast feed item-level transaction data into Jelly the moment a sale completes, which removes the manual step of pulling POS exports and cross-referencing them against inventory counts. Connecting any supported POS typically takes about five minutes.
Jelly customers see results quickly. Sushi Revolution's monthly stocktake using Jelly takes 5–20 minutes, down from 2–3 hours previously, and gross profits are 2–3% higher on average since implementing live dish costing across dine-in and delivery menus.
See Jelly's multi-site dashboard in action, and watch how live margin reporting works across your entire estate, not just one location.
Frequently Asked Questions
How quickly should I react when a supplier raises ingredient prices?
React in the same week, because every day you wait is a day of margin erosion you cannot recover. When a supplier increases the price of a key ingredient such as beef mince or cooking oil, every dish that uses it immediately has a higher food cost percentage. If that dish sat at 31% before the increase, a 9% rise in beef prices can push it above 35% without any change in portion size or menu price. The practical response is to flag the increase, request a credit note if the change was not agreed in advance, and either negotiate an alternative price or adjust the menu price before the next week's trading begins. Waiting for a monthly report means absorbing three to four weeks of margin erosion before taking action.
How do I update recipe costs when ingredient prices change mid-week?
Every recipe should sit on live ingredient costs rather than a static price list. When a new invoice arrives with a higher unit price for an ingredient, that price should flow through to every recipe that uses it automatically. In a manual spreadsheet setup, this means opening each affected recipe, locating the ingredient row, updating the price, and rechecking the food cost percentage, a process that takes 28 minutes per dish on average. With Jelly, invoice scanning updates ingredient costs across all linked recipes instantly, so the gross profit percentage for every affected dish changes the moment the invoice is processed. No manual intervention is required.
What causes food cost variance between my theoretical and actual percentages?
The most common causes are portion drift, unrecorded waste, staff meals not logged against COGS, receiving errors where the quantity delivered differs from the invoice, and theft. A variance of 2–3% of revenue is normal and reflects the practical gap between standardised recipes and real kitchen conditions. Variance above 5% consistently signals a structural issue. The diagnostic approach is to identify the top contributors by ingredient, usually the highest-cost proteins, and check whether portion weights match recipe cards, whether waste is being recorded, and whether all invoices are being captured at the correct quantities and prices.
Should I calculate food cost weekly or monthly?
Use weekly calculations for operational decisions and monthly figures for accounting comparisons. A weekly calculation catches portion creep, supplier price increases, and waste spikes within the same trading period, which allows corrective action before problems compound. A monthly figure provides a cleaner comparison against prior periods and aligns with accounting cycles, but by the time it is available the underlying issues are already four weeks old. A practical approach for many UK pubs is a full weekly COGS calculation for the top 20 ingredients by cost, which typically represent 60–70% of total ingredient spend, with a full stocktake monthly.
How does Jelly handle food cost tracking across multiple pub sites?
Jelly operates as a central platform where each site has its own invoice feed, recipe library, and margin reporting. Invoices arrive by email or photo at each location and are scanned automatically at line-item level, so ingredient costs stay current at every site. The Flash Report and Sales Mix report can be viewed per site or consolidated across all locations, giving operations managers and finance leads a single source of truth without manual data consolidation. Price alerts surface at the site level, so a head chef at one location can act on a supplier increase independently while the operations director monitors the blended picture across the estate.
Conclusion: Keeping Your Pub Menu Profitable Every Week
A 28–35% food cost percentage is achievable and maintainable for UK pubs when supported by a repeatable weekly process. The formula stays simple, using beginning inventory plus purchases minus ending inventory, divided by VAT-exclusive net food sales. The discipline sits in the inputs, with accurate counts, line-item invoices, and POS data covering the identical date range.
The operational reality in 2026 is that suppliers change prices frequently across the year, and a manual spreadsheet process cannot keep pace. By the time a monthly report reveals a problem, the margin has already been lost. Real-time invoice scanning, automated recipe costing, and POS-integrated margin reporting replace the spreadsheet entirely and provide the daily visibility that keeps food cost where it belongs.
Get a walkthrough of live food cost tracking built for UK pubs, and see how the system works with your existing POS and suppliers.