
Written by: JJ Tan, Founder, Jelly
Key Takeaways for UK Restaurants and Pubs
- Menu complexity creates hidden profit leaks through SKU proliferation, low cross-utilisation, and undetected supplier price changes that erode margins before monthly accounts reveal them.
- Automated invoice scanning and live recipe costing replace manual spreadsheets, cutting dish costing time from 28 minutes to 3 minutes and surfacing margin issues in real time.
- Five operational mechanisms, including excess SKUs and hidden price creep, turn menu growth into measurable food waste and lost revenue.
- UK operators using automated costing tools report 2-percentage-point GP gains within three months, saving £10,000+ annually on the revenue base described earlier while reclaiming 10–20 admin hours each month.
- Book a demo with Jelly to see how live invoice-to-costing workflows expose and eliminate these profit leaks.
Section 1: How Menu Complexity Shows Up on the Pass
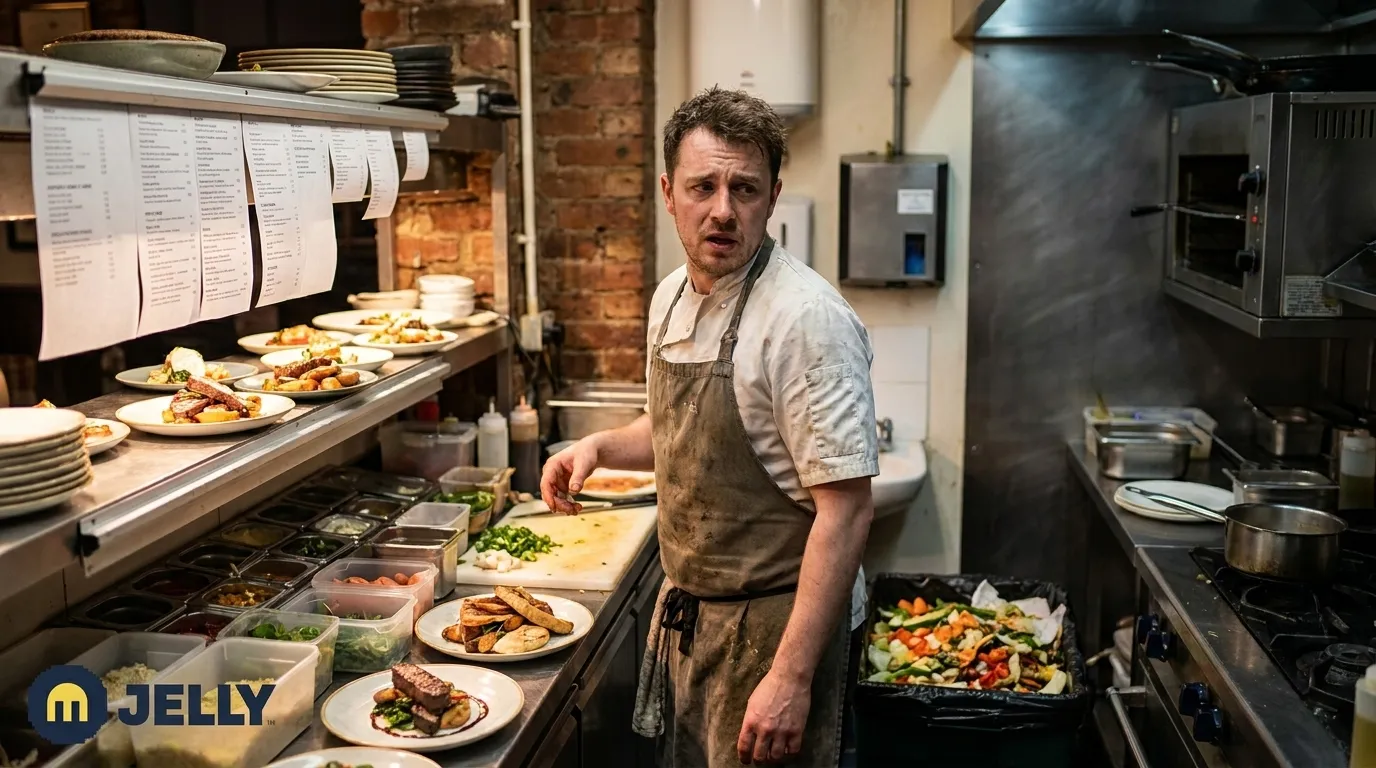
Menu complexity shows up as a walk-in fridge full of slow-moving ingredients, prep lists that exceed real demand, and a head chef who needs a spreadsheet and thirty minutes to confirm whether a dish is still profitable after the last supplier price increase.
Thomas Bissegger, Lecturer Cuisine Practice at EHL Campus Passugg, identifies large menus as a direct driver of purchasing complexity, forecasting uncertainty, and food waste. The problem sits in structure. Food waste in hospitality is frequently more of an organisational issue than a kitchen execution one, stemming from menu structures that make ingredient reuse challenging, combined with inaccurate production planning and poor inventory management.
For a UK restaurant with £500k annual revenue where food purchases equal 100% of revenue, food waste at 6% of purchases represents £30,000 lost per year at purchase value. That figure excludes the labour cost of prepping ingredients that are later discarded. Operators with organically grown menus, where dishes are added without auditing SKU and spoilage consequences, face the highest exposure.
Section 2: Manual Spreadsheets Versus Automated Costing Workflows
Manual invoice processes delay visibility of margin erosion, while automated costing systems surface it quickly. The table below compares the two approaches across four operational dimensions.
| Dimension | Manual / Spreadsheet Process | Automated Invoice-to-Costing Workflow | Operational Impact |
|---|---|---|---|
| Invoice processing | Manual data entry per line item, prone to transcription error | Every line item scanned automatically on receipt via photo or email | Eliminates 10–20 hours of weekly admin, removes input errors that distort food cost |
| Dish costing speed | 28 minutes per menu item in a spreadsheet | 3 minutes per menu item with ingredient costs pre-populated from scanned invoices | Chefs cost more dishes more frequently, pricing decisions reflect current supplier rates |
| Price change visibility | Discovered at month-end via accountant report or stocktake variance | Flagged immediately via automated price alerts on every invoice line | Enables same-week supplier negotiation, supports credit note recovery |
| GP margin reporting | Monthly, retrospective, requires accountant input | Daily Flash Report integrating invoice costs with live POS sales data | Owners and finance managers act on current performance, not four-week-old data |
The operational impacts shown above compound rapidly for operators managing multiple suppliers across two or more sites. The manual approach does not scale when every new SKU multiplies the admin burden and widens the lag between a price change and a corrective action. Book a demo, schedule a chat to see how automated invoice scanning closes that lag from weeks to hours.
Section 3: How Automated Scanning, Live Costing and Menu Engineering Work Together
Automated invoice scanning captures every line item, including quantity, SKU, unit price, and tax, the moment an invoice arrives by email or photograph. Those line items feed a live ingredient database that connects directly to recipe costing. When a supplier adjusts a price, every dish containing that ingredient updates its gross profit margin automatically, without manual intervention from the chef or finance team.
That real-time cost visibility becomes actionable when combined with sales data. Live dish costing connected to point-of-sale data adds a second layer, sales mix reporting that identifies which dishes are selling, which are profitable, and which occupy menu space while generating spoilage. Data-driven menu engineering that classifies dishes by per-dish food cost, popularity, and measured waste cuts food loss by 18% to 28% while stabilising contribution margin. The same analytical discipline that reduces waste also highlights dishes worth promoting and dishes worth removing.
Multi-site operators gain a centralised platform where the owner or finance manager sees a single source of truth across all locations. That visibility does not depend on individual chefs maintaining spreadsheets accurately or consistently.
Section 4: Five Ways Menu Complexity Turns Into Food Waste
1. Too Many SKUs and Slow-Moving Stock
A 60-item menu forces operators to stock more SKUs with lower sales velocity, and an ingredient appearing in only one dish that sells eight covers per week means a standard case is likely to spoil before turnover. Excessive SKU counts increase waste, complicate inventory management, slow kitchen execution, and make performance data harder to interpret. Live ingredient pricing tied to invoice scanning makes low-velocity SKUs immediately visible, so operators see which ingredients are ordered repeatedly but used infrequently and act before spoilage costs build up.
2. Prep Volumes That Outrun Actual Sales
When a forecasting system delivers one inaccurate recommendation, kitchen managers lose trust and revert to manual methods, padding prep numbers and ordering extra product to avoid stockouts, which directly produces the overproduction and spoilage the system was intended to prevent. Low-selling menu items often carry higher waste rates on their associated ingredients. Automated recipe costing connected to POS sales data replaces guesswork with actual demand figures and gives chefs a reliable basis for daily prep quantities.
3. Low Ingredient Cross-Utilisation Across the Menu
Maintaining twelve different oils or non-overlapping sauces produces purchasing inefficiency and prep redundancy that directly increases waste. A large menu with specialty items creates high inventory complexity and high waste risk, whereas a cross-utilised menu design produces low inventory complexity, low waste risk, and high margin impact. A live cookbook that maps every ingredient to every dish using it makes cross-utilisation gaps visible and actionable.
4. Supplier Price Creep Buried in Invoice Volume
A 25-item menu supported by a 150-item pantry list creates operational struggle due to infrequent ingredient use. The infrequent ingredient use described earlier compounds when combined with high invoice volume, and the sheer number of line items across multiple suppliers makes manual price monitoring impractical. Price increases pass undetected through weekly invoices until a stocktake or monthly report reveals the damage. Automated price alerts flag every increase and decrease at the line-item level and give operators the evidence needed to negotiate credits or switch suppliers before the margin impact compounds.
5. LTOs and Delivery Menus That Add New SKUs
An LTO requiring a unique ingredient prompts a one-time over-order, and when the promotion ends any remaining stock has no other menu application and is discarded. Ghost kitchens and virtual brands running multiple menus from a single kitchen rapidly multiply SKU counts when the menus do not share ingredients, turning each brand-specific ingredient into a spoilage liability. Delivery menu tools that duplicate existing dishes and factor in commission overheads, rather than introducing new ingredients, contain this risk structurally.
Section 5: Real Results for UK Owners, Finance Leads and Chefs
UK case studies show the financial impact of automated costing. Amber, a Mediterranean restaurant in East London, saves £3,000–£4,000 per month through invoice automation, price change alerts, and real-time recipe costing, which represents approximately 68× return on the platform cost. Chef-Owner Murat Kilic states, “Jelly keeps my business alive.”
Stuart Noble, Head Chef at Cairn Lodge Hotel, reduced food costs by 5% within one month of implementing live dish costing and price alerts. Ruth Seggie, Owner of The Howard Arms, moved gross profit from below 60% to 80% and describes the ability to react instantly rather than weeks later as the defining operational change.
Owners and finance managers typically see a 2-percentage-point average improvement in gross profit margins within the first three months, alongside the saving of 10–20 hours of admin every month. For head chefs, dish costing drops to the 3-minute benchmark shown in Section 2, and every GP margin updates automatically when a new invoice arrives. Full-service restaurants that trim oversized menus often see food costs fall within the first few months because automated costing supplies daily data instead of monthly snapshots.
Section 6: Checklist for Choosing an Automated Costing Platform
The checklist below covers criteria that matter most for UK restaurant, pub, and boutique hotel operators evaluating automated invoice-to-costing platforms.
| Criterion | What to Look For | Red Flag | Why It Matters |
|---|---|---|---|
| Onboarding speed | Initial value within the first week, no months-long implementation | Requires dedicated IT resource or consultant to set up | Delayed onboarding delays margin recovery, price alerts should be live within days |
| Invoice data accuracy | Line-item capture of quantity, SKU, unit price, and tax from photo or email | Requires manual correction of scanned data regularly | Inaccurate ingredient costs produce inaccurate dish margins, and decisions made on bad data worsen waste |
| POS integration depth | Real-time item-level sales data, setup under five minutes, supports your existing POS system | Only imports daily totals, no item-level mapping, long setup process | Item-level data is required for sales mix reporting and accurate per-dish GP calculation |
| Reporting speed and format | Daily Flash Report, live GP margin per dish, instant price alerts | Reports generated weekly or monthly only, no real-time margin visibility | Monthly reports arrive too late to act on supplier price changes or low-margin dish performance |
| Chef usability | Recipe building by clicking pre-populated ingredients, automatic unit conversion and wastage calculation | Requires manual ingredient entry or complex configuration per dish | If chefs find the tool burdensome, adoption fails and data quality degrades |
| Multi-site control | Centralised dashboard with per-location GP visibility, flat per-site pricing | Separate logins per site with no consolidated view, per-user pricing that scales unpredictably | Owners managing two or more sites need a single source of truth without proportionally higher cost |
Frequently Asked Questions
How long does it take to get value from an automated costing platform?
Most operators see initial value within the first week. Once suppliers send invoices to a dedicated email address, or the kitchen team begins photographing invoices into the platform, price alerts and spending insights go live immediately. Recipe costing follows as dishes are built using the pre-populated ingredient database. Operators should treat any platform that needs months of configuration before producing actionable data as a warning sign.
Our head chef is not particularly tech-savvy. Will the team actually use it?
Chef adoption depends on interface design. Platforms built for growing independent kitchens, rather than large chains with back-office teams, prioritise simplicity with ingredients pre-populated from scanned invoices, recipe building by clicking rather than typing, and automatic unit conversion so chefs avoid manual yield calculations. The benchmark is whether a chef can cost a dish in under five minutes without training. If the demo requires a lengthy walkthrough to reach that point, the tool is likely too complex for consistent daily use.
Can the platform support supplier negotiation, or is it just a reporting tool?
The most operationally useful platforms flag every price increase and decrease at the ingredient level, with the supplier name, previous price, and new price visible in a single view. That data provides concrete evidence to contact a supplier, request a credit note, or benchmark against an alternative. Operators who previously suspected price creep but lacked documentation to challenge it find that automated price alerts convert suspicion into a negotiable fact. One UK hotel head chef reduced food costs by 5% within a month using this approach.
We operate across multiple sites. How does centralised visibility work in practice?
Multi-site control relies on a platform that aggregates invoice data, dish costs, and GP margins across all locations into a single dashboard, without requiring the owner or finance manager to log into each site separately. Per-location pricing models stay more predictable for growing operators than per-user models, which scale unpredictably as teams expand. The practical test is whether an owner can see, from one screen, which site has the highest food cost variance this week and which supplier has increased prices across multiple locations at the same time.
Does the platform help with delivery menu profitability?
Delivery menus carry a structural profitability problem because commission rates from aggregators reduce the effective margin on every dish, while many operators price delivery menus identically to dine-in menus. Platforms that allow operators to duplicate existing menu items and apply a commission percentage to each dish, recalculating the GP margin automatically, make delivery profitability visible before the menu goes live rather than after a month of trading at a loss. This approach also avoids the SKU proliferation risk of building a delivery menu with entirely new ingredients.
How does the platform integrate with our existing POS system?
The most capable platforms integrate natively with major UK POS systems via real-time API and deliver item-level sales data the moment a transaction completes. Setup usually takes under five minutes, involving connection of the integration, permission grants, and mapping of POS items to dishes in the costing platform. The main friction point appears when the user lacks admin access to their POS account. Once connected, the integration automates reconciliation of sales against costs, a process that otherwise consumes two to five hours of manual work per week, and produces a live GP margin for every dish on the menu.
Conclusion
Menu complexity increases restaurant food waste through five compounding mechanisms, including SKU proliferation, overproduction from unreliable forecasting, low ingredient cross-utilisation, undetected supplier price creep, and uncosted LTOs and delivery menus. Each mechanism is manageable with the right data, yet together they form a structural margin leak that worsens with every new dish, supplier, and site added to the operation.
Automated invoice scanning, live recipe costing, and sales mix reporting convert these mechanisms from invisible drains into daily-visible, actionable figures. UK operators using this approach consistently recover 2 or more percentage points of gross profit within the first three months, the equivalent of £10,000 or more annually at the scale described in Section 1, while reducing the admin burden that currently consumes chef and management time.
The data exists to diagnose and fix menu-driven waste, provided it arrives in time to act. Book a demo, schedule a chat to see how Jelly delivers that visibility from day one.