
Written by: JJ Tan, Founder, Jelly | Last updated: 16 July 2026
Key Takeaways
- UK multi-site restaurants lose around £10,000 per site each year to food waste, and inconsistent tracking lets high-waste locations quietly erode group margins.
- The 2025 Separation of Waste Regulations and upcoming Digital Waste Tracking Service require accurate, centralised waste records, with financial penalties for operators who fall short.
- Standardised logging, centralised inventory, demand forecasting, and automated invoice scanning typically deliver 15–50% waste reductions and 2-percentage-point GP gains within 90 days.
- Real-time dashboards and live dish costing replace fragmented spreadsheets, so operators spot cost deviations in one day instead of 30 and keep portion control consistent across every site.
- Book a demo with Jelly to see all 12 strategies running across your sites within the first week and start protecting margins immediately.
How the UK food-waste hierarchy applies to restaurant groups
The statutory UK waste hierarchy, which covers prevention, preparing for reuse, recycling, other recovery, and disposal, sits as a legal priority under the Duty of Care and requires businesses to take all reasonable steps to apply it. For commercial kitchens this means you first prevent waste through accurate forecasting and portion design. You then redistribute suitable surplus via partners such as FareShare or Olio. Next you recycle through licensed anaerobic digestion or composting collectors. Disposal becomes the final option and now carries both cost and compliance risk under the Separation of Waste (England) Regulations 2025.
Fixing fragmented data with centralised control
Data fragmentation in restaurant groups causes 2–4 points of annual margin loss because teams react too slowly to site-level issues such as elevated food costs. The strategies below tackle that fragmentation step by step and use technology to enforce consistent controls at every site.
Measuring food waste across multiple sites
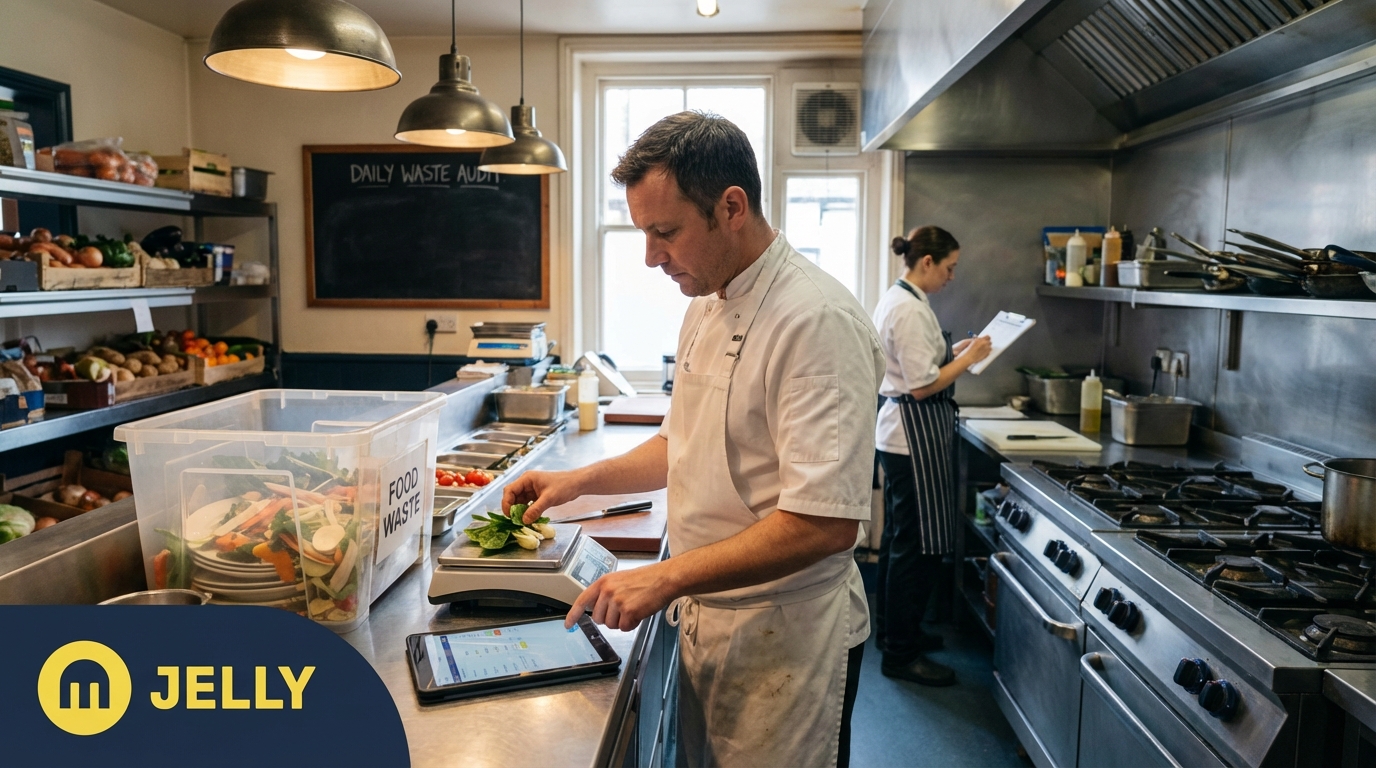
Strategy 1 — Standardise waste logging across every location. Structured food waste tracking typically yields 15–30% reduction in food waste within the first six months, with the biggest gains in the first 90 days. Each site records every discarded item by weight, cost, reason, and responsible team member. Jelly’s automated invoice scanning keeps ingredient purchase prices live, so the cost field fills accurately without manual calculation.
Measurement checklist:
- Place labelled waste bins at prep, line, and dish-pit stations so every type of waste has a clear home.
- Record item, quantity in kilograms, purchase cost, reason, and staff member daily to build a reliable data trail.
- Aggregate weekly by category such as spoilage, over-prep, plate waste, and delivery damage to spot patterns quickly.
- Review cross-site totals in a single dashboard, not separate spreadsheets, so you can compare locations side by side.
Core KPIs for multi-site restaurant waste control
The table below sets out the four core KPIs, their benchmarks, and 90-day targets for a group operating 2–5 UK sites. All figures are drawn from sector benchmark data. Use these benchmarks to pinpoint your biggest margin opportunity, because a waste rate above 10% can often recover more margin than small tweaks to all other KPIs combined.
| KPI | Laggard | Sector average | 90-day target |
|---|---|---|---|
| Waste rate (% of food purchased) | >10% | 4–10% | <6% |
| Inventory variance (theoretical vs actual) | >3% | 1–3% | <3% |
| Food cost % (full-service) | >35% | 28–35% | 28–32% |
| Gross profit margin improvement | Baseline | Baseline | +2 percentage points |
Centralised inventory to cut waste and food cost
Strategy 2 — Replace per-site spreadsheets with a single inventory system. Restaurant groups that consolidate purchasing after unifying data can improve overall food cost without changing suppliers. Jelly’s centralised Cookbook and live dish costing mean that when a supplier raises a price, every affected recipe across every site updates automatically, so teams avoid manual re-entry and hidden cost creep.
Implementation checklist:
- Migrate all supplier invoices into a single platform, using Jelly’s email or photo capture, so every ingredient price stays live and consistent across sites.
- Use those live prices to build a central recipe library with gram-level portion specifications, which ensures accurate dish costing from day one.
- Set par levels by site using actual consumption data from the recipe library, not estimates, so each kitchen orders only what it will use.
- Run weekly cross-site variance reports using those par levels as your baseline and flag any location above 3% for immediate follow-up.
With centralised inventory in place, the next ten strategies build on that foundation and automate execution across every site, from forecasting demand to enforcing compliance.
Strategies 3–12: technology-enabled execution
Strategy 3 — Demand forecasting. Restaurants using demand forecasting consistently achieve 30–50% waste reduction compared with manual estimation. Jelly’s Flash Report, available daily, weekly, or monthly, surfaces sales trends by site so kitchen teams prep to actual demand rather than habit. Checklist: connect POS, review cover counts versus prep volumes weekly, and adjust par levels monthly.
Strategy 4 — Menu engineering. A 7-location group achieved a 3.8-point drop in food cost percentage within 16 weeks through automated menu engineering that connected real-time POS, inventory, and cost data. Jelly’s Sales Mix report highlights which dishes are popular and which are profitable so operators can retire low-margin, high-waste items. Checklist: rank every dish by GP and cover count quarterly, remove or re-price items in the bottom quartile, and test reformulated dishes at one site before rolling out.
Strategy 5 — Standardised recipes. Multi-site groups achieve consistent portion control through a central recipe management system where gram-level specifications push automatically to every kitchen. In Jelly’s Kitchen section, chefs build recipes by clicking on ingredients already populated from scanned invoices, which cuts dish costing time from 28 minutes to three. Checklist: document exact gram weights for every component, laminate portion guides at each station, and audit random plates weekly during service.
Strategy 6 — Staff training and waste culture. Comprehensive staff training programmes reduce waste by 20–30% through improved staff practices. Multi-site operators should run a Train the Trainer programme and nominate key personnel at each site as local champions. Checklist: include waste protocols in every new-hire onboarding, run monthly 15-minute waste-awareness sessions using last month’s cost data, and introduce a waste-champion recognition scheme.
Strategy 7 — Supplier price-alert monitoring. Uncaptured price increases often drive food cost slippage. Jelly’s Price Alert feature flags every ingredient price movement as soon as a new invoice is scanned, which gives chefs the data they need to negotiate credits or switch suppliers. Checklist: review price alerts weekly, challenge increases above 5% with the supplier, and log credit notes received as a KPI.
Strategy 8 — FIFO enforcement. Proper FIFO rotation reduces spoilage waste by 30–50% in restaurants. Checklist: label every delivery with received date and use-by date so teams can see what to use first. Organise walk-in coolers so the oldest stock sits at eye level and naturally gets picked first. Conduct a daily 60-second line check to confirm the layout still follows FIFO. Use colour-coded date dots standardised across all sites so staff can transfer between locations without retraining.
Strategy 9 — Delivery-menu optimisation. Delivery commissions of up to 30% can destroy margins on menus priced for dine-in. Sushi Revolution used Jelly to set separate target gross profits on dine-in and delivery menus, which produced higher average gross profits. Jelly’s Delivery Menu Creation tool duplicates existing items and factors in commission overheads automatically. Checklist: build a separate delivery menu in Jelly, set a minimum GP threshold per item, and review delivery-menu performance monthly.
Strategy 10 — Real-time gross-profit dashboards. The consolidated dashboard mentioned earlier, which cuts deviation detection from 30 days to one, becomes actionable through Jelly’s Flash Report, which integrates POS sales with invoice costs to produce a live GP figure. Teams no longer wait for a monthly accountant report. Checklist: review the Flash Report daily, set a GP floor alert, and share the dashboard with site managers and head office at the same time.
Strategy 11 — Automated invoice scanning. Removing invoice pricing errors delivers meaningful savings for multi-site operations. Jelly digitises every line item, including quantity, SKU, price, and tax, via email or photo, then pushes the data directly to Xero. Checklist: route all supplier invoices to a dedicated Jelly email address, reconcile digitised invoices against delivery notes weekly, and push approved invoices to accounting software in one click.
Strategy 12 — Compliance reporting. Under the Separation of Waste (England) Regulations 2025, multi-site operators must maintain accurate waste records across all locations. A new mandatory Digital Waste Tracking Service will require waste collectors to use it from October 2027. Jelly’s automated reporting provides an audit-ready data trail of ingredient purchases, usage, and variance by site. Checklist: export monthly waste-cost reports per site, retain records for at least two years, and insert DWTS compliance clauses into waste contractor agreements now.
Book a demo, schedule a chat and see all 12 strategies running inside Jelly within your first week.
Case study: margin gains from live costing and alerts
Sushi Revolution, a modern Japanese restaurant group in South London, reduced monthly stocktake time using Jelly’s inventory feature and used live dish costing to protect margins against daily ingredient price movements. One operator using Jelly improved gross profit from 65% to 72% within 12 weeks on approximately £500,000 in revenue, a 7-percentage-point swing driven by automated invoice scanning, real-time costing, and Price Alert-driven supplier negotiations. Amber restaurant in East London saves £3,000–£4,000 per month using Jelly, achieving approximately 68× return on investment through the same combination of automated invoice processing and real-time pricing decisions.
Frequently Asked Questions
What is a realistic food waste reduction target for a multi-site restaurant group in the first 90 days?
Most multi-site operators moving from manual processes to centralised, automated tracking see waste rates fall significantly within the first quarter. The biggest gains usually arrive in the first 30–60 days, when previously invisible patterns in over-ordering, spoilage, and portioning become visible for the first time. A realistic 90-day target is a 2 percentage point improvement in gross profit margin, which aligns with what Jelly customers consistently report in their first three months.
Does Jelly help with UK Simpler Recycling compliance?
Jelly’s automated invoice scanning and reporting create a site-level audit trail of ingredient purchases, usage, and variance that supports compliance documentation. Jelly does not act as a waste-collection service. The data it generates, categorised by site, supplier, and ingredient, provides the accurate tonnage and cost records that operators need to meet the Separation of Waste (England) Regulations 2025 reporting requirements and to prepare for the mandatory Digital Waste Tracking Service coming into force from October 2026 onwards.
How does Jelly work across multiple sites without requiring a large IT rollout?
Jelly is a cloud-based platform with a flat rate of £129 per location per month and no per-user charges. Onboarding generates initial value within the first week. Suppliers begin sending invoices to a dedicated Jelly email address, or the kitchen photographs invoices directly into the app, and price alerts and spending insights appear within 24 hours. Connecting a supported POS system takes about five minutes, so there is no lengthy implementation project or need for a dedicated IT resource.
What is the difference between waste rate and inventory variance, and which should operators prioritise?
Waste rate measures the cost of discarded food as a percentage of total food purchased and acts as the headline financial KPI. Inventory variance measures the gap between theoretical ingredient usage, which is recipe quantity multiplied by POS sales, and actual usage from stock counts, which acts as the operational diagnostic KPI. Operators should track both. Waste rate shows how much margin is being lost, and inventory variance shows where and why. A variance above 3% at any single site signals waste, over-portioning, or data errors that need immediate investigation. Jelly’s live dish costing and Flash Report surface both metrics without manual calculation.
How quickly can an Executive Chef start using Jelly without disrupting kitchen operations?
Jelly suits kitchens where chefs are busy and do not want complex software. The interface stays clean and focused. Chefs build recipes by clicking on ingredients already populated from scanned invoices, and Jelly handles all unit conversions and cost calculations automatically. Dish costing that previously took 28 minutes in a spreadsheet takes three minutes in Jelly. Most kitchen teams use the platform independently within their first week, and because management has direct dashboard access, chefs no longer need to produce separate reports.
Conclusion
Manual, site-by-site processes sit at the root of the food waste that erodes margins across UK multi-site restaurants. The 12 strategies above, from standardised waste logging and centralised inventory to automated invoice scanning and compliance reporting, work as a system because they share a single data foundation. Live ingredient costs, real-time GP margins, and cross-site visibility form that foundation, which Jelly provides at £129 per location per month, with value delivered in the first week.