
Written by: JJ Tan, Founder, Jelly
Key Takeaways from Your Seven-Day Audit
- A seven-day food waste audit sets a clear baseline of what is wasted, where it happens, why it occurs, and what it costs. That baseline supports immediate purchasing, portioning, and menu decisions.
- Separate pre-consumer and post-consumer bins, weigh waste after every service, and log each item with a fixed reason code so weight converts into accurate financial figures.
- Rank waste lines by annualised cost and flag preventable versus unavoidable losses. Use this list to create a focused three-to-five-point action plan with owners and deadlines.
- Manual logging consumes 10–20 hours per week. Automating invoice capture, live dish costing, and daily GP reporting removes that workload while keeping the same level of insight.
- Once the audit is complete, see how Jelly replaces spreadsheets with automated tracking that keeps margins visible in real time.
Prerequisites and Ownership for a Reliable Audit
Confirm these inputs before day one so the audit runs smoothly from the first service:
- Supplier invoices for the audit week (paper or digital)
- A calibrated digital scale accurate to at least ±200 g
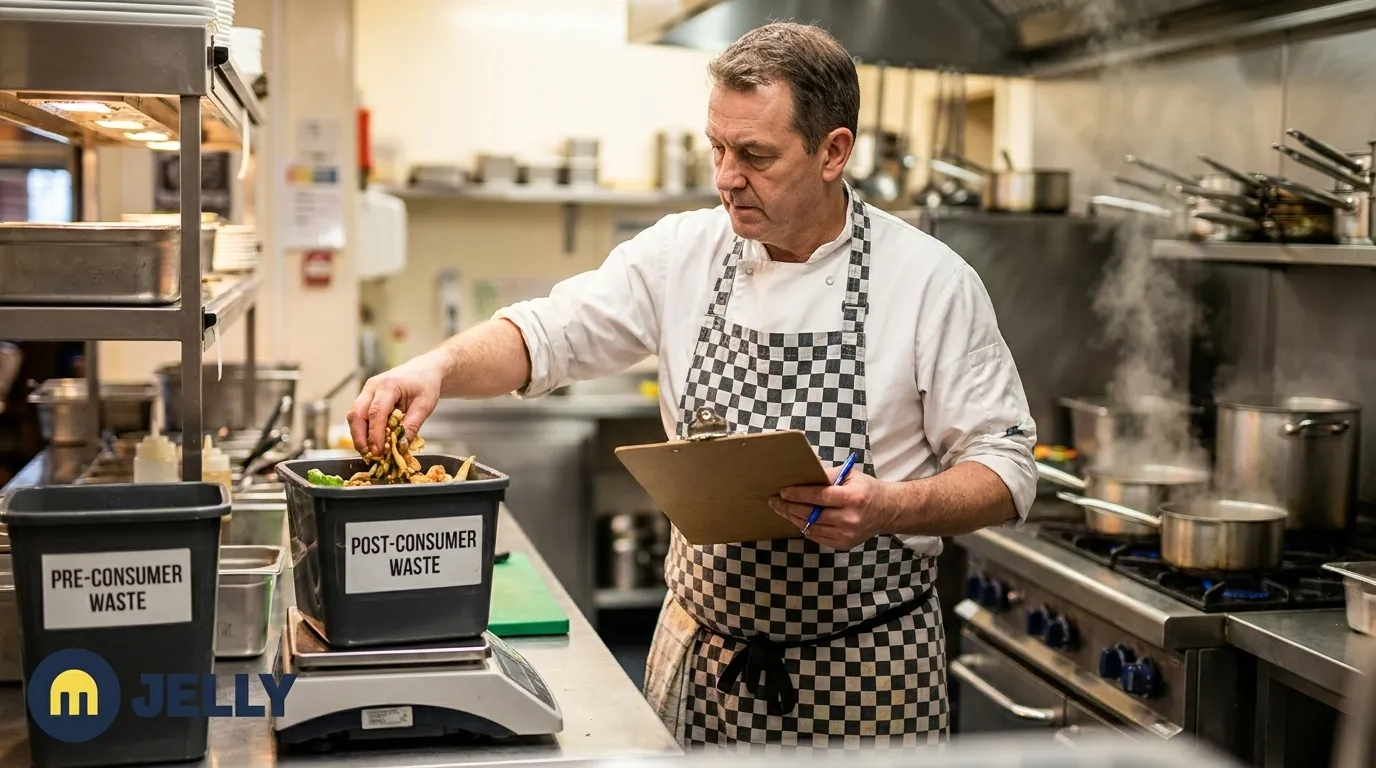
- Clearly labelled bins: pre-consumer (prep waste, spoilage, overproduction) and post-consumer (plate returns)
- POS access to pull cover counts and dish sales by day
- A designated log sheet at the prep station and service pass
Ownership of the audit sits with the owner, finance manager, or head chef. That person then assigns a single named individual to each measurement point, such as the prep station, service pass, and delivery check, because leaving responsibility to “the team” produces inconsistent data.
Why a Seven-Day Food Waste Audit Matters for UK Restaurants
Restaurants that start monitoring food waste often cut it in the early stages through visibility alone, without changing recipes or suppliers. At a site spending £30,000 per month on food with an 8 percent waste rate, £2,400 per month leaves the kitchen unrecorded. The cost of food waste usually extends beyond ingredients once labour, energy, hauling, and lost sales are included.
A seven-day audit surfaces these losses in a format that supports immediate purchasing decisions, portion adjustments, and supplier credit claims. WRAP’s hospitality guidance consistently identifies measurement as the prerequisite to any meaningful reduction programme. Once that baseline is in place, the next challenge is keeping visibility high without adding ongoing admin for managers.
Ready to stop estimating and start measuring? See how Jelly’s automated invoice scanning and live dish costing work alongside your audit findings.
Step 1: Define Objectives and the 7-Day Scope
Objective: Set exactly what the audit will measure and agree on a clear success criterion before collecting any data.
Action: Write three specific questions the audit must answer. For example, identify which waste category costs the most per week, which dishes generate the highest volume of plate returns, and whether Monday prep levels match actual Monday covers.
Required inputs: Last month’s food cost percentage, average weekly covers by day, and a list of the five highest-cost ingredients on current invoices.
Success criteria: Objectives are written, shared with the team, and pinned in the kitchen before day one begins.
Step 2: Set Up Pre- and Post-Consumer Bins with Scales and Signage
Objective: Put a simple measurement setup in place that separates controllable waste from unavoidable waste before logging starts.
Action: Place three labelled bins at each waste point, with one for preparation waste, one for overproduction, and one for plate returns. Weigh each bin at the end of every service, both lunch and dinner, and note the specific products discarded rather than relying on total weight alone. Consistent weighing at each service gives a reliable picture of daily patterns. Separate avoidable waste from unavoidable waste such as bones and citrus peels, because mixing them inflates figures and hides controllable losses.
Required inputs: Digital scale, three bin types per station, printed bin labels.
Success criteria: Every waste point has a labelled bin and a scale within arm’s reach before the first service of day one.
Step 3: Create a Simple Log for Weight, Reason Code and Cost per kg
Objective: Build a consistent daily record that converts waste weight into a financial figure using real purchase costs.
Action: Place one log sheet at the prep area and one at the service pass. Each entry should capture date, ingredient or dish, weight or count, estimated cost, category, and a one-line reason. Use the following reason codes consistently across all stations:
- PREP – trim loss, over-portioning, mise en place errors
- SPOIL – product expired or damaged before service
- OVER – batch-cooked but not served
- PLATE – returned from the pass or guest table
- RECV – damaged or out-of-spec on delivery
Use the following ready-to-use log template for each shift. The example below shows how a typical Monday’s prep and plate waste entries convert raw weight measurements into financial figures using current invoice prices:
| Date & Service | Ingredient / Dish | Weight (kg) | Reason Code | Purchase Price (£/kg) | Waste Cost (£) |
|---|---|---|---|---|---|
| Mon Lunch | Chicken breast | 0.4 | PREP | £8.00 | £3.20 |
| Mon Dinner | Salmon fillet | 0.3 | PLATE | £18.00 | £5.40 |
Required inputs: Current supplier invoices for purchase prices per kg, printed log sheets, pens at each station.
Success criteria: Every waste event includes point, cause, kilos, and cost. Under-recording should remain below 10 percent of actual waste events.
Step 4: Collect Data for Seven Consecutive Days
Objective: Build a meaningful baseline that captures day-part variation, day-of-week patterns, and delivery-day impacts.
Action: Brief the team in a stand-up before day one and explain that logging is data collection, not surveillance. Review entries daily rather than waiting until the end of the audit period. A supervisor checks each log at the end of every service and flags any blank entries before the next shift begins. A consistent rough estimate such as “medium bowl of vegetable trimmings” is more useful than a one-off precise measurement, because consistency matters more than precision in the first weeks.
Required inputs: Completed log sheets from Step 3, daily cover counts from POS, delivery schedule for the week.
Success criteria: Seven consecutive days of completed logs with no service periods missing.
Step 5: Analyse Results by Weight, Cost and Preventability
Objective: Turn raw log data into a ranked cost table that highlights the highest-value waste streams and their root causes.
Action: Tally entries by reason code and calculate the following figures for each category:
- Weekly waste cost by category: Sum of weight in kg multiplied by purchase price per kg for each reason code.
- True cost per kg including labour: Purchase price divided by yield percentage. At £20/kg with 25 percent waste, true cost rises to £26.67/kg.
- Annualised waste cost: Weekly waste cost multiplied by 52.
- Savings at 30 percent reduction: Annual waste cost multiplied by 0.30.
A restaurant with protein waste of 8 kg per week at £15/kg, produce at 6 kg per week at £1.80/kg, and dry goods at 2 kg per week at £4/kg generates £138.80 in weekly waste cost and £7,217.60 annually, with a 50 percent reduction saving £3,608.80 per year. Rank every waste line by annualised cost and mark each as preventable or unavoidable. The preventable lines form the action list for Step 6, so keep that list short and focused.
Required inputs: Completed seven-day logs, invoice prices per kg, cover counts by day.
Success criteria: A ranked table of waste lines by cost with a preventability flag on each row.
Step 6: Build an Action Plan from Your Ranked Waste Table
Objective: Turn the ranked waste table into three to five specific operational changes with owners and deadlines.
Action: For each high-cost preventable waste line, choose one of three interventions based on the reason code. If waste occurs before service with SPOIL or RECV codes, focus on purchasing. If it happens during prep or service with PREP or OVER codes, focus on portioning. If it comes back from the dining room with PLATE codes, focus on menu engineering.
- Purchasing: Reduce order quantity, change delivery frequency, or switch supplier for items with high SPOIL or RECV codes.
- Portioning: Adjust batch sizes or introduce a use-first tray for items with high OVER codes. Starch portions are almost always over-prepared and one or two menu dishes typically account for a disproportionate share of plate returns.
- Menu engineering: Re-price, reposition, or remove dishes with persistent PLATE codes and use cover-weighted sales data from your POS to identify low-volume, high-waste items.
Required inputs: Ranked waste table from Step 5, POS sales mix data, current menu with GP margins.
Success criteria: A written action plan with a named owner and a completion date for each intervention, reviewed at the next management meeting.
Step 7: Move from Manual Logging to Continuous Automated Tracking
Objective: Replace the weekly manual audit cycle with real-time, automated profitability tracking that does not require extra headcount.
Action: The seven-day audit has produced a baseline. Sustaining that baseline manually requires the same weekly time investment, and that commitment grows quickly across multiple sites. Jelly automates the entire flow. Invoices are scanned line by line the moment they arrive by email or photo, ingredient costs update automatically across every recipe, and GP margins refresh in real time. The Price Alert feature flags every supplier price movement in the same week, giving the head chef the data needed to negotiate credits or switch suppliers before margins erode. The Flash Report delivers a daily, weekly, or monthly GP view by integrating directly with your POS system and connects in under five minutes.
Required inputs: Supplier invoice email address or photo upload workflow, POS admin credentials, Jelly account.
Success criteria: Invoices flow into Jelly automatically, dish costs stay live, and a daily GP report replaces the manual weekly audit.
Troubleshooting Common Audit Problems
Three problems account for most failed audits, and they appear frequently enough that they deserve early attention.
- Inconsistent reason codes: Staff use free-text descriptions instead of the five standard codes. Fix this by laminating the reason code list and attaching it to each log clipboard before day one.
- Missing delivery records: Damaged or short deliveries are discarded without logging a RECV entry, which understates true waste cost. Fix this by assigning one person to check every delivery against the invoice and log discrepancies before the delivery driver leaves.
- Staff resistance: Logging feels like surveillance rather than a professional tool. Fix this by sharing the cost figures from Step 5 with the team. When chefs see that £12,000 per year is leaving the kitchen in preventable waste, they usually treat logging as part of running a tight kitchen.
Success Metrics After Your First Month
Track these KPIs at the end of week one and again at week four to confirm that changes are working:
- Food cost percentage, with a target reduction of 1–3 percentage points within 60 days
- Weekly waste cost by category, with a target reduction in the top two preventable lines
- Time spent on data entry, with a target drop from 10–20 hours to under two hours per week once Jelly is live
- Speed of supplier price-spike identification, with a target of spotting changes in the same week rather than the following month
Restaurants have already reduced food costs by logging waste and then acting on the findings to cut produce spoilage and overproduction.
Scaling Across Multiple Sites with Real-Time Tools
ReFED recommends piloting waste tracking in one or two high-volume locations first to minimise disruption and prove impact before wider rollout. For multi-site operators, standardise the audit template from Step 3 across all locations with identical reason codes so data stays comparable. A three-location group running a consolidated 2 percent waste rate can hide a single site running at 4 percent. On £3,000,000 in combined annual food cost, a site with a 4 percent waste rate incurs £120,000 per year.
Jelly scales directly with this model. Each location runs at a flat £129 per month with no per-user charges, and management can see Flash Reports, Price Alerts, and Sales Mix data across all sites from a single dashboard. One operator improved gross profit from 65 percent to 72 percent within 12 weeks on approximately £500,000 in revenue after connecting Jelly’s invoice automation to their POS.
Conclusion: Turning a One-Off Audit into a Weekly Habit
A seven-day food waste audit acts as the first iteration of a measurement discipline that grows in value every week it runs. The steps above give any UK restaurant, pub, or boutique hotel a repeatable process. Define scope, set up measurement infrastructure, log by reason code, collect seven days of data, calculate true costs, build a targeted action plan, and then automate the cycle so it no longer needs heavy manual admin.
Jelly is built for this transition from the first manual audit to continuous, automated profitability tracking that updates the moment a new invoice arrives or a dish is sold. The typical result is the 3 percent food cost reduction outlined earlier, achieved within the first quarter. The audit shows where the money is going. Jelly keeps that money in the business.
Frequently Asked Questions
How long does a restaurant food waste audit take to run?
The active measurement phase runs for seven consecutive days and usually needs around 10–15 minutes of staff time per service to weigh bins and complete log entries. The analysis in Step 5 takes about one hour at the end of the week. The total time investment for a first audit, including setup and action planning, is typically four to six hours spread across the week. Once Jelly connects to your invoices and POS, ongoing tracking requires no manual logging because the platform updates costs and margins automatically as invoices arrive and sales are recorded.
What reason codes should a restaurant use in its food waste log?
Five reason codes cover most restaurant waste events. PREP covers trim loss, over-portioning, and mise en place errors. SPOIL covers product that expires or is damaged before service. OVER covers batch-cooked food that is not served. PLATE covers items returned from the pass or guest table. RECV covers product damaged or out-of-spec on delivery. Using a fixed set of codes rather than free-text descriptions keeps data comparable across days, services, and sites and enables root-cause analysis rather than simple weight totals. Laminate the code list and attach it to every log clipboard before the audit begins.
How do I calculate the true cost of food waste per kilogram?
Use this basic formula: True cost per kg equals purchase price divided by yield percentage. If chicken breast costs £8 per kg and 20 percent is lost to trim, the true cost of the usable portion rises to £10 per kg. To include labour and storage, add roughly 20 percent on top of the purchase value as a practical approximation for purchasing, unpacking, storing, and disposing time. For an annual picture, multiply your weekly waste cost by 52. Jelly automates this calculation. As each new invoice is scanned, ingredient costs update across every recipe and dish margin in real time, so the true cost stays current without manual recalculation.
What is a normal food waste percentage for a UK restaurant?
Food waste rates for UK restaurants typically range from 4 to 10 percent of food purchases, although this varies by concept. Fine-dining operations often run higher because of premium fresh ingredients and complex prep, while high-volume or standardised kitchens usually achieve lower rates. The most important number is your own baseline from the seven-day audit, because that figure becomes the reference point for every subsequent week. Operators using Jelly’s automated tracking consistently see meaningful GP improvements within the first three months as price alerts, live dish costing, and daily Flash Reports highlight specific waste drivers that manual spreadsheets miss.
When should a restaurant move from manual auditing to automated waste and cost tracking?
The manual seven-day audit is the right starting point because it builds team awareness and produces a cost baseline without new technology. The case for automation becomes clear as soon as the first audit is complete. Sustaining weekly manual logging across prep stations, service passes, and delivery checks requires the time commitment outlined earlier, and the data always arrives after the fact. Automated tools like Jelly remove that burden by scanning every invoice line item on arrival, updating dish costs in real time, and integrating directly with your POS to deliver a live GP view. The transition works best immediately after the first audit, when the baseline is fresh, the team understands why measurement matters, and the action plan from Step 6 needs ongoing data to confirm whether interventions are working.