
Written by: JJ Tan, Founder, Jelly
Key Takeaways
- Connecting daily waste logs with weekly stocktake variance gives you a clear view of where food cost is leaking and how to fix it.
- Standardised reason codes such as spoilage, over-production, and plate waste turn raw waste entries into usable root-cause analysis.
- Corrected actual usage = Opening stock + Purchases − Closing stock − Waste recorded. Comparing this to theoretical usage exposes true variance.
- Weekly trend reviews by reason code, followed by prompt recipe-cost updates, keep GP margins accurate and stop outdated prices from skewing future calculations.
- Ready to automate invoice scanning, live unit costs and real-time variance tracking? See how Jelly automates your variance workflow.
How Waste Tracking Fits into Your Stocktake Routine
Tracking restaurant waste during stocktake means logging every discarded item daily with a reason code and a live unit cost from the latest supplier invoice, then subtracting that recorded waste from the standard actual-usage formula at the weekly count. This process produces a corrected actual-usage figure that you can compare against theoretical usage derived from POS sales and recipe specifications. You then feed variances back into recipe costs so margins stay current and stocktake results reflect real performance.
Before You Begin: Inputs and Waste Log Template
Three inputs are required before running this workflow:
- Latest supplier invoices with line-item unit costs
- A daily waste log (template below)
- POS access for item-level sales data to calculate theoretical usage
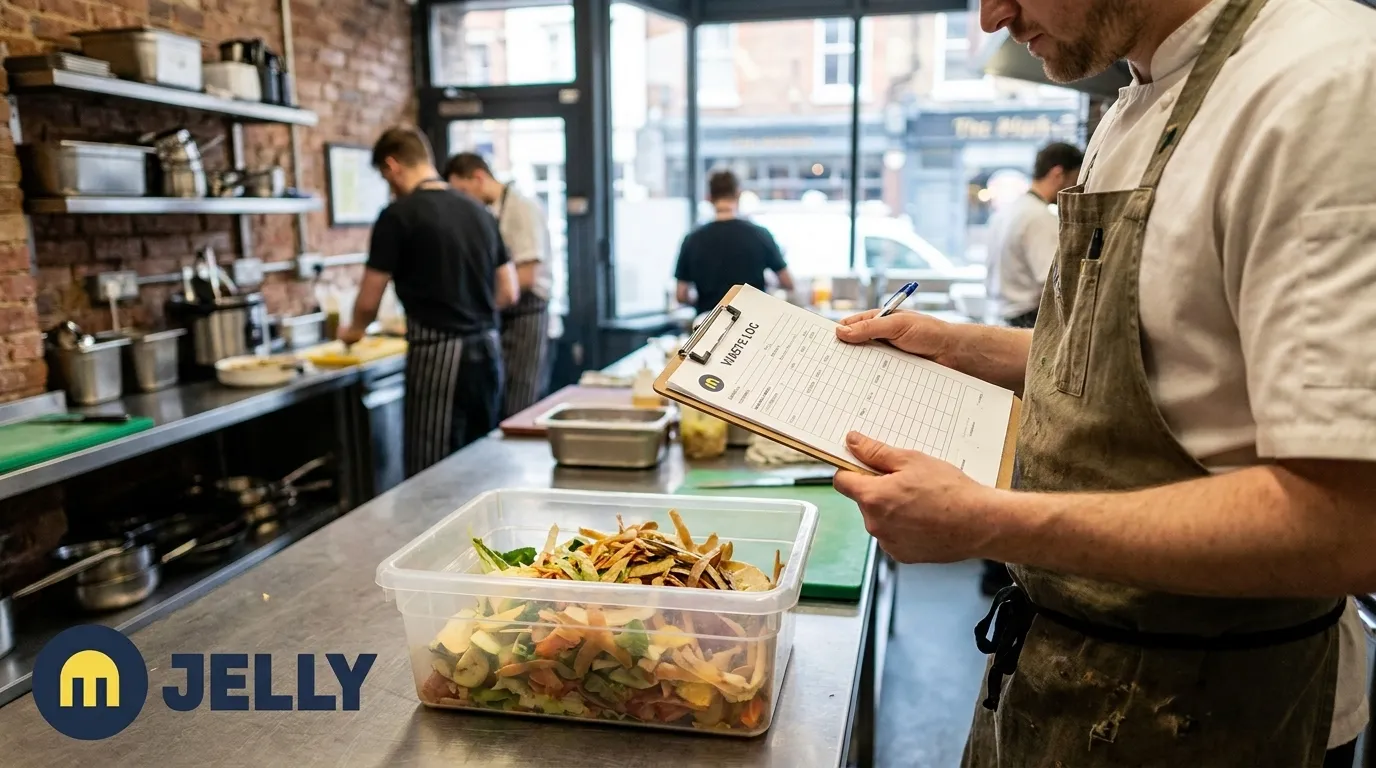
Copy and paste this waste log template into a shared sheet or print it for each service. The six-column layout captures the minimum data needed for variance analysis: date and staff create accountability, item and quantity allow aggregation by ingredient, unit cost values waste at current prices, and the reason code supports root-cause analysis during the weekly review.
| Date | Item | Qty & Unit | Unit Cost (£) | Reason Code | Staff |
|---|---|---|---|---|---|
| — | — | — | — | — | — |
With the template structure in place, the next step is to define the standardised reason codes that will populate the “Reason Code” column, which turns raw entries into usable insight.
Step 1: Set Up the Daily Waste Log with Reason Categories
Expert-recommended waste categories for UK restaurants map directly to operational owners, which speeds up root-cause analysis. Use the following standardised reason codes:
- Spoilage, passed use-by date or deteriorated before use, points to over-ordering or FIFO failures.
- Prep waste / trim, trimmings and offcuts, should be compared against recipe-specified yield to spot excess.
- Over-production, mise en place prepared but not sold, points to inaccurate covers forecasting.
- Plate waste, food returned by customers, signals portion or quality issues when patterns repeat.
- Dropped / spilled, accidents during service, should be checked for patterns by station or shift.
- Customer return / remake, incorrect or unsatisfactory dishes, points to specification or communication failures.
- Temperature failure, items lost to cold-chain or hot-holding failure, highlights equipment or handling issues.
Coding every entry with a reason code turns a simple list into a diagnosis. This approach lets you cluster losses for root-cause analysis instead of treating waste as one undifferentiated total.
Step 2: Log Waste at the End of Every Service
Each entry needs four core pieces of information: the item name, the quantity in inventory units, the unit cost pulled from the most recent supplier invoice, and the reason code. Every wastage log entry must also record the date, time, and the staff member who logged it so you can rely on the data during review.
This example shows how those fields work together in practice.
| Date | Item | Qty & Unit | Unit Cost (£) | Reason Code | Staff |
|---|---|---|---|---|---|
| 06/08/2026 | Chicken breast | 1.2 kg | £6.40/kg | Over-production | J. Smith |
The unit cost must come from the latest invoice, not a memorised figure. UK restaurants typically waste around 18% of food purchased, so stale unit costs understate the real cost of that waste and distort the variance calculation later.
Ready to remove the manual steps from this process? See how Jelly scans invoices automatically and updates unit costs in real time.
Step 3: Run the Variance Calculation at Stocktake
At the weekly count, use this formula to calculate corrected actual usage:
Actual usage = Opening stock + Purchases − Closing stock − Waste recorded
Then compare against theoretical usage from POS sales multiplied by recipe specifications:
Variance (£) = Actual usage − Theoretical usage
Variance (%) = (Variance ÷ Theoretical usage) × 100
Worked example for chicken breast over one week. This table shows how subtracting recorded waste from the standard formula isolates true unaccounted variance, the 1.0 kg difference between actual and theoretical usage that remains after documented waste is removed.
| Input | Quantity | Unit Cost | Value (£) |
|---|---|---|---|
| Opening stock | 8 kg | £6.40/kg | £51.20 |
| Purchases | 20 kg | £6.40/kg | £128.00 |
| Closing stock | 5 kg | £6.40/kg | £32.00 |
| Waste recorded | 1.2 kg | £6.40/kg | £7.68 |
| Actual usage | 21.8 kg | — | £139.52 |
| Theoretical usage (POS) | 20.8 kg | — | £133.12 |
| Variance | 1.0 kg | — | £6.40 (4.8%) |
A 4.8% variance warrants investigation. KitchenNmbrs identifies a revenue deviation of more than 10% as calling for action, with no mention of a 3–8% normal operating range. The target for this workflow is to minimise variance, and well-managed operations often aim for under 3% as a longer-term benchmark. A higher variance can signal systemic issues such as over-ordering, spoilage, or untracked usage that require immediate action.
Having identified that variance exists, the next step is to understand which operational failure caused it, so you can correct the process rather than just record the number.
Step 4: Conduct a Weekly Trend Review
Once the variance calculation is complete, review the waste log by reason code. Calculate total waste cost by reason code, rank causes by £ impact, and focus improvement efforts on the top two or three causes.
Use these patterns to choose targeted actions.
- Spoilage trending up, tighten par levels or review delivery frequency so stock moves before expiry.
- Over-production recurring, adjust prep sheets using historical covers data to bring mise en place closer to demand.
- Plate waste on a specific dish, review portion size or dish specification to match what guests actually finish.
- Variance high but waste log empty, treat this as a red flag because unexplained depletion with an empty log indicates items leaving the kitchen through unrecorded routes.
Groups running weekly variance audits catch shrinkage patterns within 7–10 days, while those relying on monthly audits allow controllable loss to build up across several weeks.
Identifying the cause of variance is necessary but not sufficient, so the final step is to feed corrected unit costs back into recipe cards and close the loop.
Step 5: Feed Corrected Costs Back into Dish Recipes
A variance calculation only delivers value when it triggers a recipe update. When the weekly review confirms a unit cost has changed because a supplier invoice shows a price increase, every dish containing that ingredient must have its recipe cost updated before the next service.
This update is critical because recipe decks often contain menu items with stale ingredient costs, and those stale costs corrupt the theoretical usage baseline used in the variance formula. If the recipe card says chicken costs £6.00/kg but the current invoice shows £6.40/kg, the theoretical usage figure will understate true expected consumption, which makes variance calculations unreliable even when waste is logged accurately.
Beyond fixing the variance calculation, updated recipe costs also feed the GP margin calculation for each dish. Operators who run this step consistently, updating recipe costs within 24 hours of receiving a new invoice, can spot margin erosion early and adjust menu prices or portion sizes so COGS reduces over time.
Common Mistakes and How to Fix Them
- Missing unit-cost updates. Using last month’s invoice price instead of the current one distorts both the waste cost and the variance calculation because the waste log will undervalue discarded items if prices have risen, and the theoretical usage figure will be calculated against an outdated baseline. This mismatch makes variance appear artificially high even when kitchen performance is stable. Fix: pull unit costs from the most recent invoice at the point of logging, not from memory or a static spreadsheet, so both waste and theoretical usage use the same current market rate.
- Inconsistent reason codes. When staff use different codes for the same type of waste, trend analysis becomes meaningless. Fix: laminate the seven reason codes and post them at each logging station, then brief the team at the start of each shift.
- Forgetting to log during service. Restaurants that begin monitoring food waste with daily logging can cut waste in the first month because visibility changes staff behaviour, but only if logging happens every service. Fix: assign one person per shift as the waste log owner and make end-of-service logging part of the closing checklist.
How to Measure Success
Three metrics confirm the workflow is functioning correctly:
- Low variance at weekly stocktake, trending lower over time.
- GP uplift within the first few months as corrected recipe costs and reduced waste feed through to margins, consistent with results seen across Jelly’s customer base.
- Stocktake admin time cut by at least half, with Sushi Revolution reducing their monthly stocktake from 2–3 hours to 5–20 minutes using Jelly.
Want to see these results in your operation? Talk to the Jelly team about your variance goals.
Advanced Tips: Automate the Workflow with Jelly
Every step in this guide can be executed manually. The constraint is time, because pulling live unit costs from invoices, updating recipe costs after each delivery, and running variance calculations across dozens of SKUs each week adds hours of admin that most kitchen teams cannot sustain consistently.
Jelly removes those manual steps by automating the entire flow from invoice to variance. When a supplier invoice arrives by email or photo, Jelly scans every line item and updates ingredient costs across all linked recipes in real time. The Price Alert feature flags every unit cost change the moment it appears on an invoice, giving chefs the data to negotiate credits or switch suppliers before the next stocktake. The Flash Report pulls POS sales data from integrated systems including Square, Lightspeed, EPOS Now, and Toast to calculate theoretical usage automatically, so the variance formula runs without manual data entry.
The result is a workflow where daily waste logging feeds directly into a live GP margin for every dish, and stocktake variance is visible in real time rather than calculated retrospectively on a spreadsheet. The time saved, as seen in the Sushi Revolution case above, goes back into service rather than admin.
Jelly charges a flat £129 per month per location with no per-user fees, and onboarding generates initial value within the first week.
Frequently Asked Questions
How often should waste be logged?
Waste should be logged at the end of every service, not accumulated and entered at the end of the week. Daily logging captures the reason code and unit cost at the point of discard, when both are accurate. Retrospective logging from memory produces unreliable reason codes and often uses outdated unit costs, which corrupts the variance calculation at stocktake. For high-value proteins and premium ingredients, some operators also run a brief mid-service check to catch over-production before it compounds across a full service period.
Who owns the daily waste log in a multi-site operation?
Ownership should sit with one named person per site per shift, typically the senior cook or sous chef on duty, rather than being a shared responsibility with no clear accountability. At the site level, the head chef or kitchen manager reviews the log daily and owns the weekly trend analysis. In a multi-site operation, the operations manager or executive chef reviews variance data across sites to identify whether a pattern is site-specific or systemic. Assigning clear ownership at each level prevents the log from being treated as optional during busy periods.
What happens when a supplier changes pack size?
A pack-size change affects the unit cost used in both the waste log and the recipe cost. If a supplier moves from a 5 kg case to a 4 kg case at the same case price, the per-kilogram cost increases, and every recipe containing that ingredient must be updated before the next stocktake or the theoretical usage figure will be wrong. The fix is to update the unit cost in the waste log and recipe cards the moment the new invoice arrives, not at the end of the week. Jelly’s automated invoice scanning flags pack-size and price changes via the Price Alert feature as soon as a new invoice is processed, so the update happens without manual checking.
How quickly can variance drop below 7%?
Consistent daily logging often leads to measurable improvement within the first few weeks because visibility changes staff behaviour around portioning and waste recording. The time to reach a sustained low variance depends on how consistently the five steps are followed and how quickly recipe costs are updated after invoice changes. Operators using Jelly to automate invoice costs and recipe updates can reach a GP improvement benchmark within the first three months.
Conclusion: Turn Stocktake into a Margin System
The five-step workflow, set up standardised reason codes, log waste daily with live unit costs, run the corrected variance formula at stocktake, review weekly trends by category, and feed corrected costs back into dish recipes, turns an existing stocktake routine into a margin-protecting system. The target is ≤7% variance and a 2 percentage point GP uplift within 90 days, achieved without adding significant admin hours to an already stretched kitchen team.
Jelly automates the steps that break down under pressure, including invoice scanning, live unit cost updates, recipe costing, and real-time variance visibility through POS integration. The manual process works, and the automated version sustains it.
See how Jelly fits into your existing stocktake routine.